Menu
Industry Solutions
Buildings & Places Hotels & HospitalityGuest comfort and estate performance
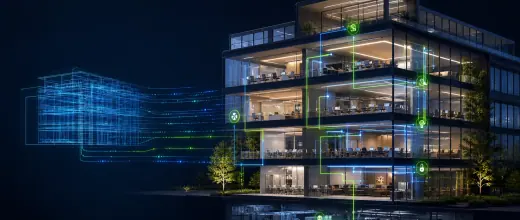 Office BuildingsOccupancy-led performance
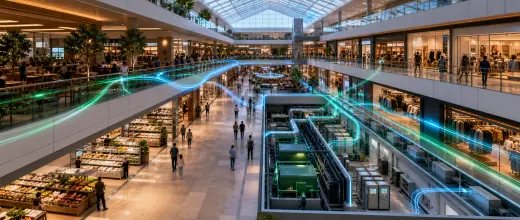 Retail & MallsTrading-hours intelligence
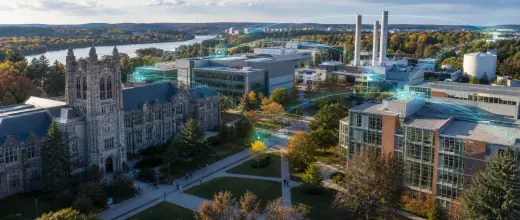 UniversitiesCampus-wide energy decisions
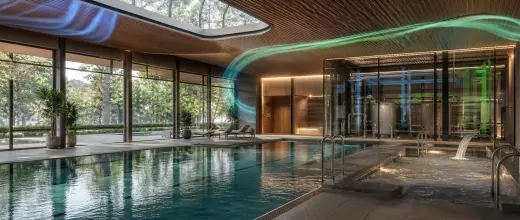 Wellness CentresWater, humidity and comfort
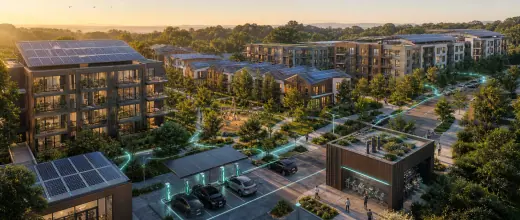 Residential CommunitiesHomes and shared infrastructure
Hotels & HospitalityGuest comfort and estate performanceOffice BuildingsOccupancy-led performanceRetail & MallsTrading-hours intelligenceUniversitiesCampus-wide energy decisionsWellness CentresWater, humidity and comfortResidential CommunitiesHomes and shared infrastructureCritical Infrastructure Airports & TerminalsContinuous terminal operations
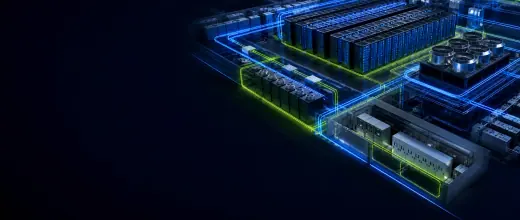 Data CentresCooling, power and resilience
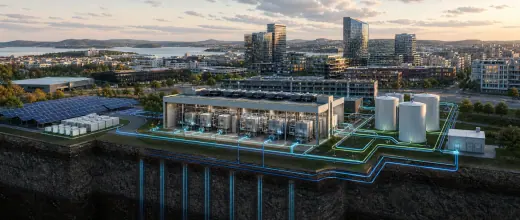 Utilities & District EnergyGeneration, storage and demand
 Ports & LogisticsCargo-linked energy operations
Airports & TerminalsContinuous terminal operationsData CentresCooling, power and resilienceUtilities & District EnergyGeneration, storage and demandPorts & LogisticsCargo-linked energy operationsIndustrial & Operational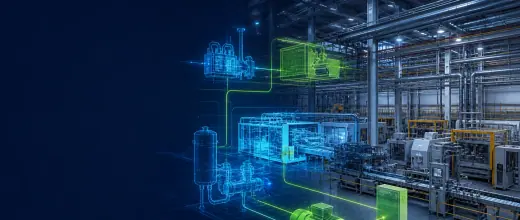 ManufacturingProduction-linked intelligence
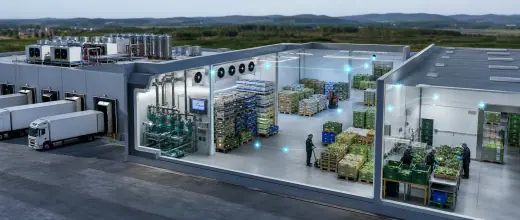 Food & Cold ChainTemperature-assured optimisation
ManufacturingProduction-linked intelligenceFood & Cold ChainTemperature-assured optimisation
Resources
Operational Energy Digital Twin
Understand energy.Test change.Decide with confidence.
ENERGE TWIN transforms property and energy evidence into an operational Digital Twin - so teams can find waste, test improvements and invest with greater confidence.
Evidence-governed intelligence. Existing systems stay in place.
LIVE DIGITAL TWIN
Optimising energy flowTesting a better live allocationEnergy Flow Analysis
See how operating energy is analysed and allocated across the estate.
Total energy100%Live operating load
Optimised72%Controlled allocation
Remaining load28%HVAC and other demand
Analyse
ENERGE TWIN Operational Energy Digital Twin
From energy signals to
decisions you can defend.
ENERGE TWIN connects building evidence, operational context, analytics and scenario testing in one decision environment. Understand what is happening, explore what could change, and evaluate options before committing operational or capital investment.
Understand
See how energy behaves across the property, floors, zones and systems.
Test
Compare operational changes, efficiency measures, solar, BESS and other scenarios.
Decide
Evaluate energy, financial and carbon impact with visible assumptions and evidence.
Evidence
MeteringReal-time energy data
BMSSystem & equipment data
WeatherExternal conditions
TariffsEnergy pricing information
SchedulesOperational schedules
AssetsBuilding & system inventory

Digital TwinVirtual representation of the building
AnalyticsBaseline, anomalies, insights
ScenariosTest operational, efficiency & energy scenarios
DecisionConfident choices with measurable impact
Evaluate impact across what matters
EnergykWh, demand, cost
FinancialCAPEX, OPEX, ROI
CarbonEmissions, targets
Designed for the way energy decisions are actually made.
Operational context first
Decisions grounded in how buildings actually operate.
Evidence you can trust
Provenance and uncertainty are always visible.
Test before you invest
Explore options, compare outcomes, reduce risk.
Measured
Derived
Modelled
Representative
From signals to decisions
Not another energy dashboard.
Traditional dashboard
DataChartsReports
Shows what already happenedENERGE TWIN
DataDigital TwinUnderstandSimulateDecide
Tests what should happen nextSee what is happening, understand why, predict what comes next, and test the operational and financial impact of change before implementation.
Discover the operating modelEXECUTIVE
OUTCOMES
Operational intelligence
that can be measured.
ENERGE TWIN connects energy, assets, occupancy and climate data into one decision layer, helping leadership teams act before inefficiency becomes cost.
Energy reduction
Modelled portfolio opportunity
15-30%Illustrative energy opportunity
TO VALIDATE THIS ESTIMATENormalised utility and interval-meter baseline, adjusted for weather and occupancy.
Peak demand reduction
Through intelligent load control
12-25%Illustrative energy opportunity
TO VALIDATE THIS ESTIMATEHalf-hourly demand profiles, control schedules and verified peak-period response.
Renewable utilisation
Improved use of on-site generation
10-22%Illustrative energy opportunity
TO VALIDATE THIS ESTIMATEGeneration, storage, export and site-load data reconciled to the same time interval.
Comfort maintained
Guest experience remains protected
15-28%Illustrative energy opportunity
TO VALIDATE THIS ESTIMATETemperature, humidity, setpoint compliance and service records during the measurement period.
Illustrative modelled outcomes based on representative operating scenarios. Actual results depend on asset profile, climate, tariffs and operating conditions.
EVIDENCE
IN CONTEXT
See how modelled strategies work in complex hospitality environments.
Case study 01 - Luxury hospitality portfolio
Reimagining portfolio operations with Digital Twin intelligence
Explore a representative hospitality scenario connecting energy, demand and guest comfort across a complex operating estate.
Read the case study Created by CEBS WorldwideCase study 02 - Coastal resort destination
Building a connected path to sustainable coastal hospitality
See how a representative destination model brings hotels, villas, utilities, renewables and mobility into one operating view.
Read the case study Created by CEBS Worldwide Digital Twin TechnologyENERGE TWIN
Real-time energy intelligence for smarter buildings and estates
PLATFORM
CAPABILITIES
Connect operational signals, explain performance and test improvements before implementation.
ENERGE TWIN Platform
A live operational model for connected energy decisions.
ENERGE TWIN creates a live Digital Twin of buildings and facilities, enabling teams to monitor, analyse and optimise energy performance using the systems already in place.
By combining connected data, operational context and simulation, the platform provides deep visibility into how energy flows across buildings, equipment and operating conditions.
Transform data into intelligence
Turn raw energy evidence into actionable intelligence for smarter, lower-carbon operation.
01
Monitor every signal
Bring bills, meters, BMS, occupancy, weather, tariffs and asset data into one governed evidence layer.
02
Detect inefficiencies
Normalise consumption against weather, occupancy and operating conditions to explain where energy is going - and why.
03
Predict what comes next
Forecast demand, identify abnormal behaviour and surface emerging operational risks before they become cost.
04
Optimise equipment performance
Coordinate HVAC, lighting and operating schedules around real demand and agreed constraints.
05
Integrate renewable energy
Compare solar, storage and grid contribution using the same operational and financial evidence.
06
Test before investing
Compare operational, technology and renewable scenarios before committing capital or changing the physical asset.
Current100%Modelled91%
Understand what changed, why it changed and what to do next.
Measure generation, storage and grid interaction in one connected energy picture.
How this supports decisionsCompare generation, self-consumption, export and storage contribution by interval, then identify when stored or generated energy creates the greatest operational value.Relate energy signals to occupancy, equipment and operating conditions.
How this supports decisionsExplain variance using occupancy, weather, schedules, tariffs and asset behaviour so teams can distinguish genuine opportunity from expected operating demand.Turn insight into prioritised action that reduces waste without compromising operations.
How this supports decisionsRank actions by modelled value, operational risk, confidence and verification method, then track whether approved changes deliver the expected result.HOW IT
WORKS
Your journey to
energy optimisation.
From setup to verified savings in four practical steps.
Connect your building
Weeks 1-2Connect existing BMS, meters, sensors and operating systems without wholesale replacement.
- Quick integration
- Works with existing BMS
- Non-invasive installation
- Baseline established
Create the Digital Twin
Weeks 3-4Synchronise operational evidence and create a precise virtual representation of the estate.
- Live data synchronisation
- Asset model calibration
- Historical pattern analysis
- Evidence governance
Test and optimise
ContinuousRun scenarios to test energy strategies without operational risk and compare likely outcomes.
- Scenario modelling
- What-if analysis
- Indicative projections
- Risk-aware testing
Implement and measure
OngoingDeploy approved improvements and verify performance while maintaining comfort and service.
- Governed implementation
- Real-time monitoring
- Continuous optimisation
- Measured outcomes
Physical assets
Buildings, equipment and energy sources
- Live sensors
- Data streaming
- Multi-property
What connects
Meters, BMS, sensors, tariffs, occupancy and weather are aligned in one governed operating view.
Why it matters
Teams gain current context without replacing the systems already in place.
AI-powered mirror
Virtual replicas with governed intelligence
- Predictive analytics
- Scenario modelling
- Auto-optimisation
What it does
Explains variance, forecasts demand and tests supported scenarios against the same baseline.
Decision value
Compare likely savings, comfort, risk and confidence before approving a change.
Optimised results
Lower costs and carbon
- Measurable savings
- Carbon reduction
- Operational efficiency
What is verified
Track energy, peak demand, carbon, comfort and implementation status against the baseline.
Decision value
Every approved action remains traceable to its evidence and measured outcome.
Understanding your Digital Twin
A living operational mirror, not a static model.
ENERGE TWIN continuously relates physical assets to real operating evidence so teams can understand current performance, simulate change and learn from verified outcomes.
Live synchronisation
Keep asset behaviour, schedules and operating context connected.
Predictive analytics
Forecast demand, detect drift and identify emerging performance risk.
Scenario modelling
Compare interventions before committing operational or capital resources.
Governed optimisation
Support governed actions within agreed comfort, safety and service constraints.
Works with your existing systems
Add intelligence without replacing the estate.
ENERGE TWIN sits above current operational technology and enterprise platforms, preserving existing investment while creating a connected decision layer.
Scenario intelligence
What happens if we change this?
Compare an operating intervention against the governed baseline before committing teams or capital.
HVAC scheduleSetpoint +1°CPre-coolingPeak tariff
- Cost
- £2,180/day
- Carbon
- 3.4 tCO2e
SIMULATE12 months
- Energy
- -15.2%
- Cost
- -£118k
- Payback
- 2.4 yr
- Confidence
- 92%
Representative scenario for illustration. Property-specific results require governed evidence and modelling.
Executive outcomes
Make energy performance measurable - and investable.
Translate engineering evidence into the operating, financial and carbon context needed by facilities, finance and sustainability teams.
- Find abnormal consumption and operational waste
- Rank opportunities by value, payback and impact
- Compare solar, storage and efficiency scenarios
- Verify whether implemented savings happened
PORTFOLIO OPPORTUNITYREPRESENTATIVE
Potential annual value£284,000Across modelled interventions
18%Energy opportunity
2.8 yrModelled payback
14%Peak reduction
Representative illustration only. Property-specific results require governed evidence and modelling.
INDUSTRIES
WE SERVE
Designed for Complex Global Industries
Our platform adapts to the unique energy profiles of diverse property types worldwide.
Hotels & Hospitality
Connect occupancy, comfort and energy performance across complex guest environments.
How it worksguest-room HVAC, kitchens, laundries, pools and occupancy-led controls.What to expectExpect clearer baselines by occupancy and service zone, with comfort constraints protected.
15-30%Guest comfort and HVAC optimisation
Explore Airports & Terminals
Coordinate continuous operations across terminals, utilities and transport systems.
How it worksterminal HVAC, baggage systems, lighting, ground power and 24-hour demand.What to expectExpect prioritised terminal actions that respect safety, passenger flow and continuous operation.
12-25%Terminal operations and demand optimisation
Explore Healthcare
Improve performance while protecting critical operating and comfort requirements.
How it workscritical ventilation, chilled water, sterilisation, resilience and patient comfort.What to expectExpect evidence-led optimisation that preserves clinical ventilation, resilience and patient comfort.
10-22%Resilient clinical energy optimisation
Explore Office Buildings
Optimise occupancy-led comfort, schedules and portfolio energy performance.
How it worksoccupancy schedules, HVAC zoning, lighting, lifts and tenant energy allocation.What to expectExpect better schedules, tenant comparisons and verified savings without compromising workplace comfort.
15-28%Occupancy-led building optimisation
Explore Retail & Malls
Compare stores, common areas and refrigeration across diverse operating profiles.
How it worksrefrigeration, food courts, common areas, tenant loads and trading-hour peaks.What to expectExpect store-level benchmarking, peak-demand visibility and practical refrigeration improvements.
12-26%Trading-hours and refrigeration optimisation
Explore Universities
Coordinate teaching, research and residential buildings through one evidence model.
How it workslaboratories, teaching spaces, residences, district systems and seasonal occupancy.What to expectExpect campus-wide prioritisation across laboratories, residences and teaching schedules.
14-27%Campus and laboratory optimisation
Explore Manufacturing
Understand production-linked demand and equipment-level energy behaviour.
How it worksproduction lines, compressed air, process heat, motors and shift-based demand.What to expectExpect production-normalised energy insight, equipment diagnostics and lower avoidable process demand.
10-24%Production-normalised efficiency potential
Explore Data Centres
Connect cooling, power quality and infrastructure resilience to energy decisions.
How it workscooling efficiency, UPS losses, rack load, power quality and resilience margins.What to expectExpect cooling and power-chain visibility with efficiency actions ranked against resilience risk.
8-18%Cooling and power-chain optimisation
Explore Wellness Centres
Balance pools, spas, humidity and ventilation with comfort and efficiency.
How it workspools, water heating, humidity control, ventilation and variable visitor demand.What to expectExpect tighter humidity, pool and hot-water control while maintaining the visitor experience.
12-25%Pool, humidity and hot-water optimisation
Explore Sports & Arenas
Model event schedules, crowd demand and variable operating conditions.
How it worksevent schedules, floodlighting, catering, crowd comfort and rapid load changes.What to expectExpect event-specific baselines, pre-event forecasts and controlled recovery after peak demand.
12-28%Event-led demand optimisation
Explore Residential Communities
Coordinate homes, shared amenities and district utilities across one estate.
How it workshomes, shared services, EV charging, amenities and community-level demand.What to expectExpect community-level visibility across homes, amenities, EV charging and shared utilities.
12-25%Community and shared-services optimisation
Explore Government & Smart Cities
Prioritise public estate improvements with transparent investment evidence.
How it workspublic buildings, street lighting, water systems, mobility and capital planning.What to expectExpect transparent investment priorities, comparable public assets and auditable outcome evidence.
10-24%Public-estate improvement potential
Explore Food & Cold Chain
Protect temperature-critical operations while reducing refrigeration waste.
How it worksrefrigeration, defrost cycles, cold rooms, process loads and temperature assurance.What to expectExpect refrigeration actions linked to product temperature, operating cycles and compliance evidence.
12-30%Cold-chain performance optimisation
Explore Utilities & District Energy
Model grid, solar, storage and demand as one connected energy system.
How it worksgeneration, thermal networks, solar, battery storage, tariffs and flexible demand.What to expectExpect coordinated generation, storage and demand decisions with tariff and network constraints visible.
8-22%Generation, storage and demand optimisation
Explore Ports & Logistics
Connect warehouses, vessels, cranes, fleets and shore power around cargo flow.
How it workscranes, warehouses, reefer loads, shore power, fleets and vessel turnaround.What to expectExpect energy decisions aligned with cargo flow, turnaround schedules and shore-power availability.
10-26%Cargo-flow and shore-power optimisation
Explore ENERGY
OPPORTUNITY
Find the value worth
investigating.
Use familiar estate and bill inputs to frame a preliminary efficiency range. No implementation price, payback promise or public ROI claim- ENERGE TWIN validates the opportunity using governed property evidence.
Potential value
A conservative range communicates uncertainty instead of presenting a guaranteed saving.
Transparent basis
Reported energy spend, unit rate, property type and size remain visible in the assessment.
Commercially responsible
Implementation cost, payback and ROI remain part of a verified, scoped commercial process.
Confidence pathway
ENERGE TWIN turns preliminary potential into a governed baseline and actionable opportunity case.
ENERGY OPPORTUNITY ASSESSMENT
Understand the value worth investigating
Enter readily available estate information to see a preliminary efficiency range-not an implementation quote or guaranteed return.
- Enter estate data
- Review potential range
- Validate the evidence
Potential annual efficiency valuePreliminary assessment · United States · USD
$24,000-$45,000A preliminary range of energy spend that may be worth investigating. It is potential value before technology, integration, implementation and ongoing service costs-not a promised saving.
$300,000 reported annual energy spend1,875,000 kWh estimated annual consumption38 kWh/sq ft indicative energy intensity$72,000-$135,000 indicative three-year value range
What the assessment usesScreening estimate only; project economics require validation.
- Annual energy spend$25,000 × 12 = $300,000
- Estimated annual use$300,000 divided by 0.16 per kWh = 1,875,000 kWh
- Preliminary efficiency rangeOffice building: 8-15% of reported energy spend
- Potential annual value$300,000 × 8-15% = $24,000-$45,000
ASSESSMENT CONFIDENCEPreliminary · user-input based
Build a verified opportunity case ENERGE TWIN can replace this broad range with a governed baseline using interval meters, tariffs, BMS, occupancy, weather and operating schedules.
ENVIRONMENTAL
IMPACT
Drive sustainability
while cutting costs.
Reduce carbon, eliminate avoidable energy waste and improve the evidence behind ESG reporting.
CO2 reduction
Illustrative modelled opportunity, not a guaranteed outcome
How to substantiateUse at least 12 months of metered electricity and fuel data, normalised for weather, occupancy and operating hours. Apply published location-based and market-based emission factors, then verify avoided emissions against the approved baseline.Evidence: utility bills, interval meters, baseline model, emission-factor source and reporting period.
Energy waste eliminated
Illustrative modelled opportunity, subject to site conditions
How to substantiateCompare actual interval-meter and BMS consumption with a governed counterfactual baseline. Adjust for weather, occupancy, production and service changes, and isolate approved interventions using an appropriate measurement and verification boundary.Evidence: half-hourly meter data, BMS trends, schedules, intervention log and measurement and verification report.
Evidence traceability
Target coverage for output classification, not outcome accuracy
How to substantiateRequire every published output to carry its evidence state: measured, derived, modelled, representative or unavailable. Retain its source, timestamp, transformation logic, assumptions, model version and approver.Evidence: lineage register, calculation record, model version, approval history and audit export.
Key impact areas
HVAC optimisation
Identify waste while maintaining operating and comfort constraints.
Up to 30% modelled opportunityLighting efficiency
Reveal scheduling and control opportunities.
Adaptive control opportunityRenewable integration
Compare grid, solar and storage contribution.
Grid, solar and BESSWater conservation
Connect water-system and energy performance.
Connected resource insightCertifications & standards
Evidence prepared for recognised reporting frameworks.
Organise performance data for ISO 50001, GHG Protocol, GRESB and portfolio ESG reporting.
Sustainability features
Transparent progress without unsupported claims.
Track baselines, renewable contribution, avoided emissions and verified improvement with clear evidence status.
FAQ
Practical answers for owners, operators and sustainability leaders evaluating Digital Twin energy intelligence.
Frequently
Asked Questions
DECISION
GUIDE
What leaders ask before getting started
Clear answers on value, implementation, governance and operational continuity.
Discuss your estate01What is a Digital Twin for energy management?
It is a live virtual representation of an estate's energy systems. It combines operating data, equipment behaviour, occupancy and external conditions so teams can monitor performance, test scenarios and compare actions.
02How is ENERGE TWIN different from a building management system?
A BMS controls equipment. ENERGE TWIN adds an intelligence and decision layer that connects multiple systems, explains performance and tests change.
03How does an engagement begin?
We begin with a focused portfolio assessment, confirm available evidence and establish a practical baseline before modelling opportunities.
04When can measurable results be expected?
Initial findings can emerge during baseline development. Verified results follow implementation and an agreed measurement period.
05How are security and operational continuity protected?
Integration is non-invasive, access is governed and existing control systems remain in place. Changes follow agreed approvals.
06Which buildings and estates can benefit from ENERGE TWIN?
Hospitality, healthcare, offices, airports, campuses, manufacturing, retail, data centres, communities, utilities and other complex estates can benefit.
07What data is required to create a useful Digital Twin?
A useful starting point can include asset information, historical bills, meter data, schedules and operating context. Detail increases as more evidence becomes available.
08Can ENERGE TWIN work with our existing BMS, PMS and enterprise systems?
Yes. It is designed to connect existing operational and enterprise systems through one governed evidence layer.
09Do we need to replace existing meters or control systems?
No. ENERGE TWIN normally works above existing infrastructure, with targeted additions only where evidence gaps justify them.
10How are savings calculated and verified?
Baselines account for weather, occupancy and operating conditions. Implemented results are compared with the agreed baseline and evidence status remains visible.
Get in touch
Ready to understand what your energy estate could reveal?
Discuss a tailored Digital Twin strategy for your portfolio.
Powered byCEBS WorldwideEnergy intelligence for better asset decisions.
Direct contact
Prefer to contact us directly?
Choose the team that best matches your enquiry.
General enquiriesProduct, company and general enquiries.info@cebsworldwide.comMedia and pressPress, interviews and brand enquiries.media@cebsworldwide.comPartnershipsTechnology, channel and delivery partnerships.partners@cebsworldwide.comSales and assessmentsEstate assessments, demos and commercial discussions.sales@cebsworldwide.com